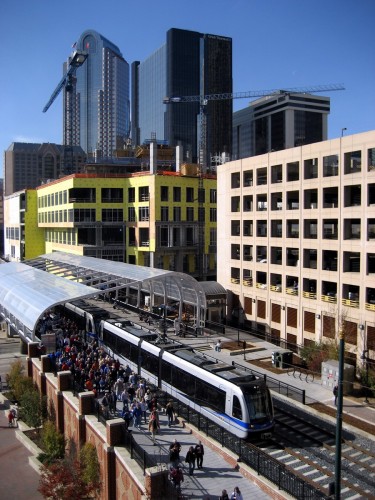
Recently, the Center for Transit Oriented Development released a report about 3 relatively new light rail lines. The Blue Line in Charlotte, the Hiawatha in Minneapolis and the SE Corridor in Denver. The timing of this report is perfectly aligned with the release of 2010 census results. According to the summary of the TOD report, all the routes attracted high levels of private investment; most notably closer to their downtown areas where the built environment is already dense and block size is smaller. The report concludes that while transit was likely not the key element of the gains seen, they helped to stretch already budding CBD development further out and focused along these rapid transit routes. This should serve as a measuring stick for future transit development locally when peer cities are enjoying the growth that investment in transit has bred. With this knowledge, lets explore how the 2010 census reflects these investments.
Denver
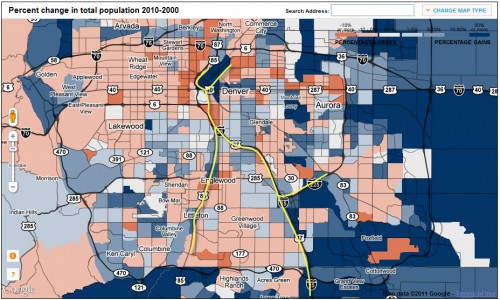
In 1994, Denver embarked on a radical plan of expanding their transit system. They have 5 routes currently, and are expanding at a rapid pace in all directions with light rail and commuter rail service as well as a single BRT system that will run to the NW. Their initial line, in the downtown area, was a 5.3 mile light rail system. Along with the current rail lines, Union Station is being rebuilt to accept additional regional rail lines, Amtrak and a dedicated bus facility. It has been an impressive investment in increasing mobility for the region’s residents. A combination of increased taxes as well as public-private partnerships have allowed construction to continue even in the current economic climate. You can see fr0m the census results, and the current light rail lines, that population gains seem to follow these corridors. Coupled with the data from the CTOD report, this shows that people are indeed following the new corridors of development. Of note however, the rails lines also follow automobile corridors so an argument could be made that development has followed that as well. One fact remains apparent though, the rail lines are obviously serving the areas where people are moving.
Charlotte
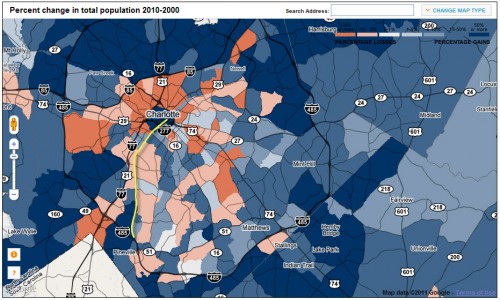
Charlotte seems to have gotten the most favorable return on investment based upon the CTOD report. I reported on Charlotte and their Blue Line last year over at my blog, before I joined urban Indy. They have indeed seen an impressive amount of investment along their light rail line. And the census numbers indicate that this is the case; especially closer to DT. The sad case of Charlotte though, is that they are a town that has been heavily affected by the economic downturn. What started as an ambitious plan for a rail network has been scaled down and drawn out over a longer amount of time. Their dedicated funding source is based on a sales tax system and is prone to high fluctuation in revenue collection as a function of local economic activity. However, as the census and CTOD report show, Charlotte has embraced rail transit and improved their population base as a result.
Minneapolis
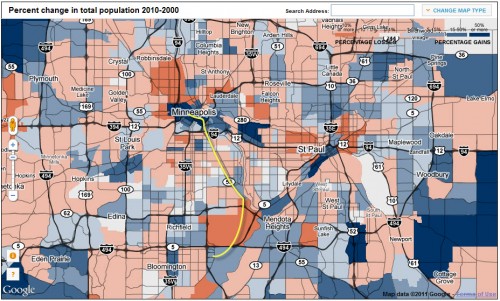
I admittedly do not study Minneapolis as much as I should. It is a bit of an oddity as a Midwest city in that it is very progressive, has a higher proportion of whites (compared to peer Midwest cities) and is also a dual CBD MSA. That said, there are many lessons to learn from Minneapolis. In regards to their transit system, their light rail network has already laid one route, with shovels in the ground for a second one and plans for further expansion. I seldom hear about a mass outcry by residents of the Twin Cities to reduce spending on transit. Minneapolis seems to have been the lowest on return on their investment in regards to light rail investment. This may have something to do with the route in that it runs parallel to a highway. In terms of connectivity, a large barrier. However, when we look at the census returns, their downtown has been highly repopulated. Although the gains along the route are lower than the DT area, the gains are modest. This in itself is worthy of mention. As time goes on and this route matures, development may follow previous gains.
Kansas City
As a comparison, I thought I would look at Kansas City and their “KC Style” BRT. It is called The MAX and operates on a limited stop basis in the core of the region, along a north/south corridor and has generally contributed to an incresae in ridership along it’s route. It has also been cheap to implement due to it’s low cost infrastructure. High performance has occured via signal priority and dedicated lanes at some points along it’s route. During peak commuting times, headways are 10 minutes. At other times, 15 minutes and outside of major demand, every 30 minutes. Of note, Kansas City’s MAX lacks a dedicated transitway like you would find in Cleveland or along one of Latin America’s many BRT routes.
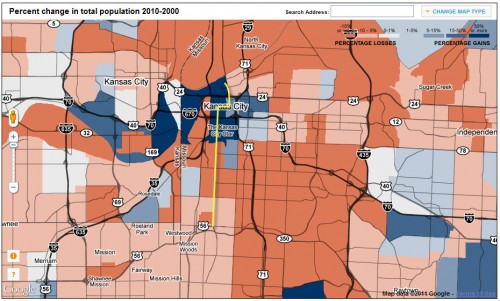
In KC, the reception has been positive according to the flyer on the transit agency’s website. Looking at the map, it is difficult to tell whether the first line, which went into service in 2005, has affected population shift. A recent Indystar article (who’s link is now dead) pointed out that development along the “BRT” route has been sparse.
Conclusions
Do these studies paint a picture of light rail transit being superior to bus? Do they paint a picture of light rail transit being an effective generator of urban growth? The results seem to indicate that it is. Affecting sprawl based policy is a large challenge. However, when compared to roadway expansion and the associated demands of such investment, light rail offers a superior tool for urban renewal. The census numbers alone can be inconclusive in some cases however, the CTOD report confirms this with robust stastics. In the case of Denver however, there is clearly a visual trend towards repopulation along the rail corridors. Perhaps as our economy recovers, this growth will speed up. It should also be noted that mode matters, and these gains follow rail rapid transit lines, not commuter lines.
Thoughts?
One thing to mention about the Hiawatha Line in Minneapolis is that it travels through a fairly mature corridor. There has been some development along the line, but it’s definitely back-fill and some development on miscellaneous lots. A not inconsiderable amount of ridership has come via park-and-ride lots near the southern end of the line, connecting suburbanites to the city for both work and sporting events.
The second line being worked on, the Central Corridor, may turn out to be a more interesting case study. While it goes through a fairly mature corridor as well, it goes up a commercial street highly dependent on its on-street parking — and that will lose much of that parking as part of the project. The line also passes through several concentrated ethnic neighborhoods and some areas of poverty. The line originally had planned to just pass through the poorer section without stopping. (Seriously.) That plan has been amended. How the line then impacts that neighborhood will be worth watching.
I apologize upfront for being slightly off topic, but I have to voice my disbelief about the recent developments around Cincy’s Streetcar initiative. I was hoping this would be a catalyst for Indy to develop something similar. I think Streetcar would have even more impressive return on investment than light rail commuter lines. Typically lower in cost with shorter distance between stops (mostly going through dense urban neighborhoods vs. serving suburban commuters), you would likely see development 3 blocks left and right of the rail. If they can’t get it done (with financing already in place — mostly federal), then I am not very optimistic about our uphill battle in Indy.